
What Power BI development actually involves
Power BI development is the work of connecting your business systems to Power BI, modeling that data so the numbers are consistent, and building reports on top of it. Most of the effort goes into the two invisible layers: the integrations that pull data out of accounting, CRM and ERP systems on a schedule, and the semantic model that defines what each measure actually means. The dashboards are the last step, not the project.
That is also why implementations fail. A report built directly on raw exports works until a source changes or two people define revenue differently. Building the model first is what makes the reporting hold up. Where several systems have to be joined, or history kept beyond what the source retains, the model usually sits on a managed data warehouse rather than directly on the sources.
What our Power BI development services include
We build complete Power BI environments. Every engagement is scoped to your data landscape - these are the core capabilities we deliver.
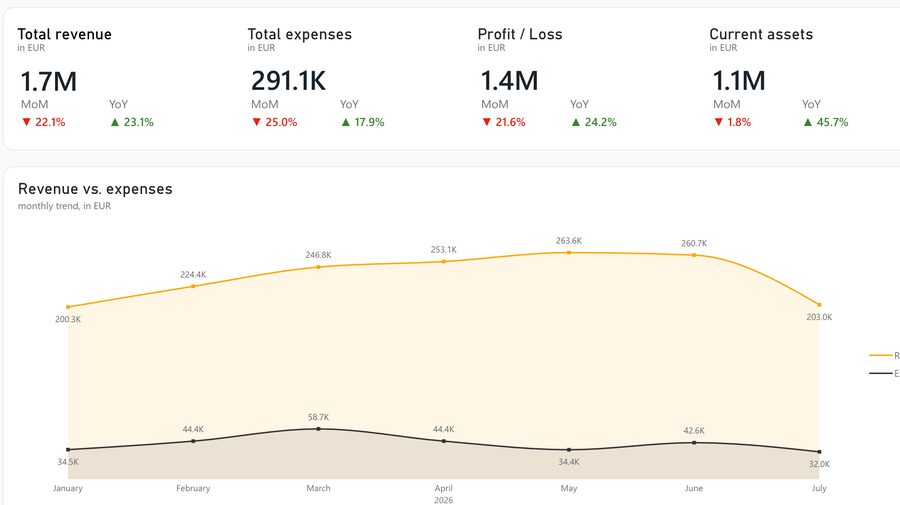
Dashboards and analytics
A dashboard is only worth building if it changes a decision, so we design around the decisions your team makes weekly rather than around whatever data happens to exist. Executive KPIs, sales, operations and finance, with drill-down from any figure to the transactions behind it.
- Executive KPI dashboards
- Sales performance analytics
- Operational reporting
- Financial performance dashboards
- Drill-down interactive reporting
- Embedded analytics
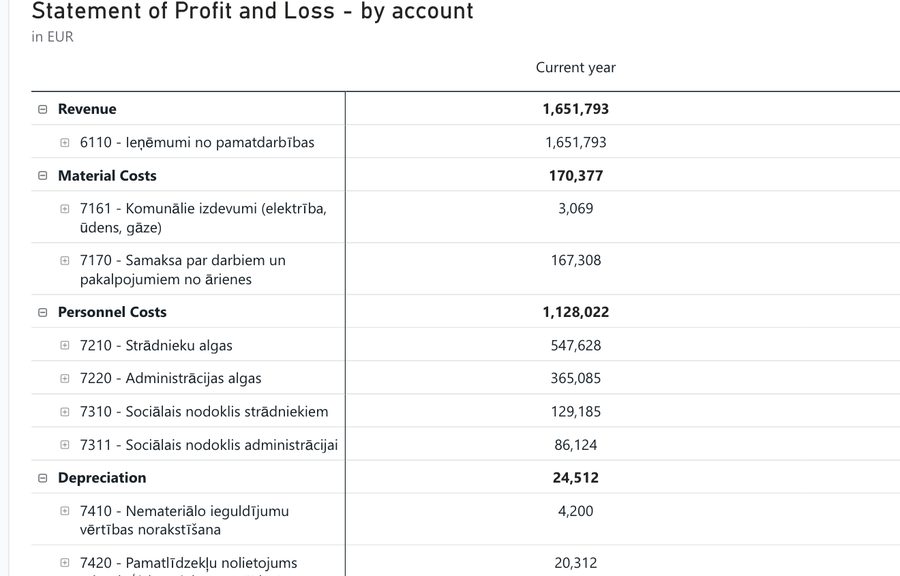
System integrations and connectivity
Your data is pulled out of each system on a schedule and landed in one place, so nobody exports anything by hand again. We build the pipelines, handle authentication and paging, and keep them running when a source API changes underneath you.
- Xero, QuickBooks, Moneo, Jumis/Pro, Horizon, Ozols
- ClickUp, Monday.com, Asana, Jira
- REST APIs, OAuth2, JSON transformation
- Paginated retrieval & automated refresh
- Multi-endpoint orchestration
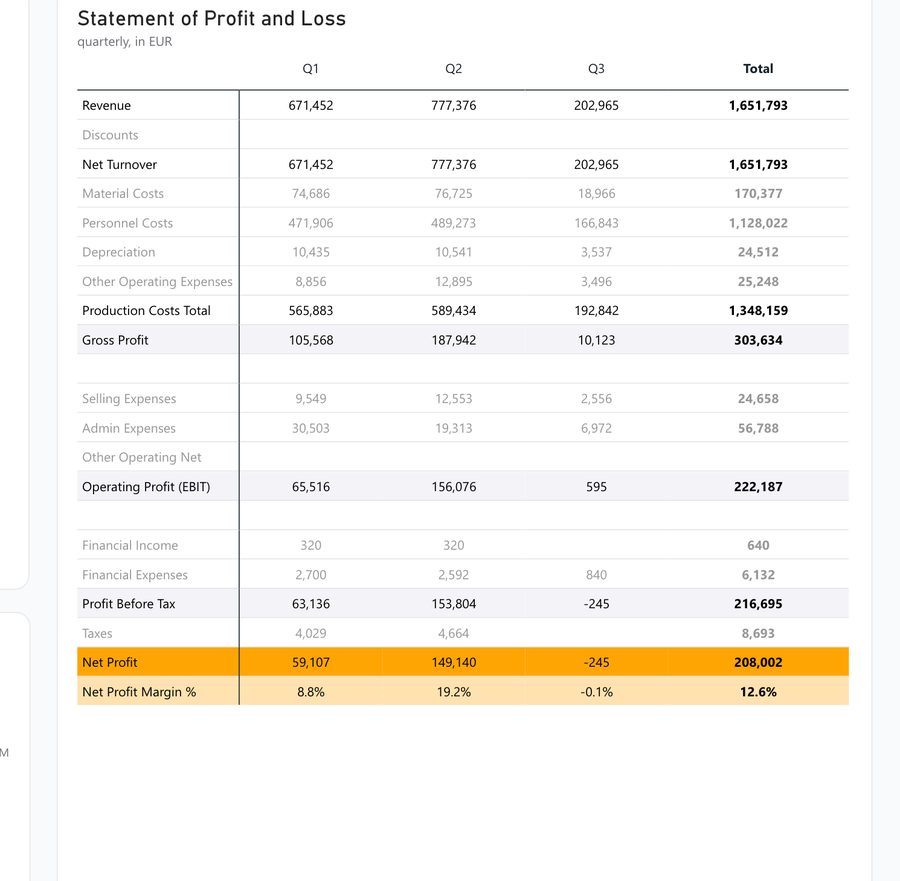
Data modeling and architecture
The semantic model is the reason two people asking the same question get the same answer. It defines each measure once - net revenue, margin, churn - so every report inherits that definition instead of each one calculating it slightly differently.
- Scalable semantic models
- SQL transformations & Power Query
- dbt implementation
- Star-schema design
- Incremental refresh & historical tracking
- Data normalization
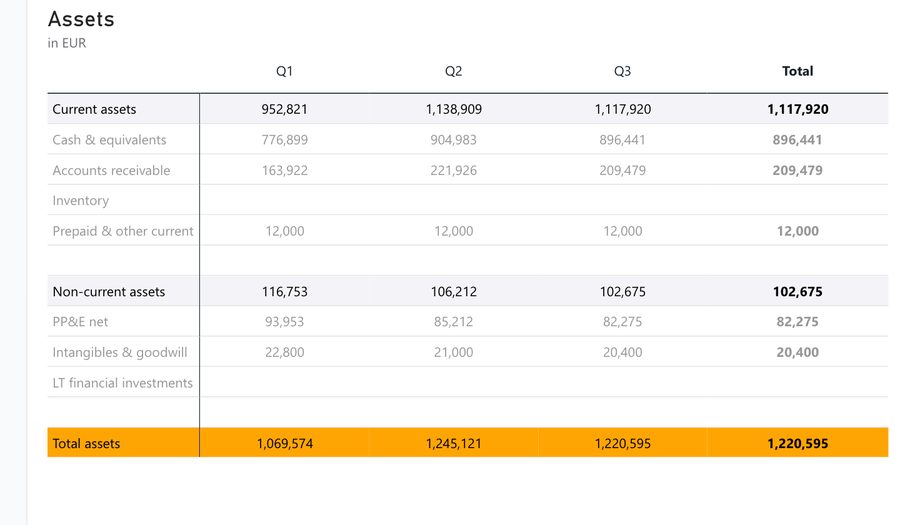
Governance, security and licensing
Governance decides who sees what. With row-level security a regional manager opens the same report as the board and sees only their own region, so you stop maintaining a separate file per audience and stop emailing spreadsheets around.
- Power BI license provisioning
- Microsoft 365 consulting
- Workspace governance
- RLS implementation
- Environment separation
- Documentation & standards
Bring your data sources. We will tell you what is realistic before you commit to anything.

Data case studies
Case studies coming soon.
Build a Power BI environment that scales with your business
Book a strategy call and receive a comprehensive assessment of your current data architecture - before any commitment.
- Current reporting architecture assessment
- Integration complexity analysis
- Automation opportunity mapping
- Governance readiness review
- Scalability roadmap planning
Power BI Development FAQ
Everything you need to know before starting a Power BI engagement with Codnity Data.